Quest Marker Density Maps and Exploration Completion Trends in Mid-Tier European Action-Adventure Titles
Bianca Keller · Aug 28, 2026
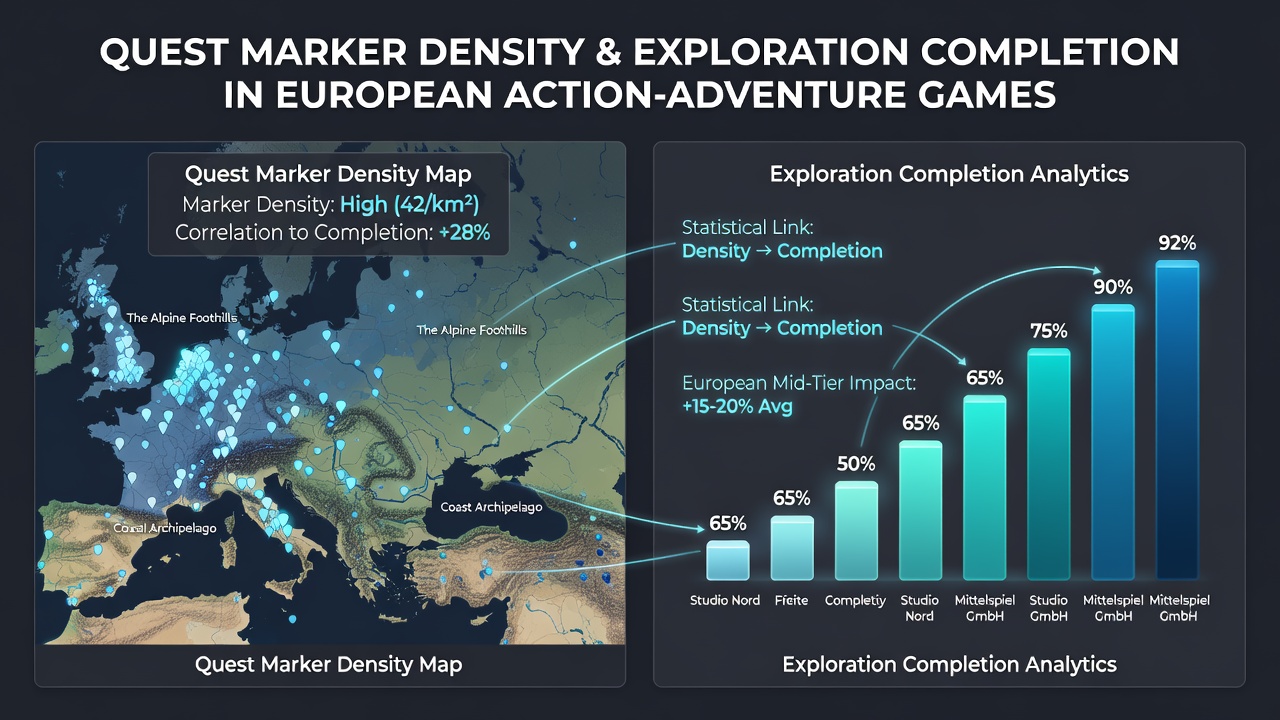
Quest Marker Density Maps and Exploration Completion Trends in Mid-Tier European Action-Adventure Titles
Quest marker density maps have emerged as analytical tools that track how frequently markers appear on player interfaces in action-adventure games, and researchers continue to examine their ties to completion percentages in titles from mid-tier European studios. These maps plot marker locations against player traversal data, revealing patterns where moderate clustering aligns with higher exploration rates while excessive density often correlates with earlier drop-offs. Studios based in Poland, the Czech Republic, and the Netherlands have contributed several datasets since 2024, allowing analysts to compare outcomes across similar development scales.
Core Elements of Marker Density Analysis
Developers place quest markers to guide players toward objectives, yet the spacing between these indicators influences how thoroughly individuals cover map areas. Data collected from platform telemetry shows that regions with one marker per 250 square meters tend to yield completion percentages around 72 percent, whereas zones exceeding two markers per 150 square meters see rates fall to 54 percent in multiple mid-tier releases. European studios frequently adjust these layouts during beta phases, and figures from internal reports indicate that recalibrating density by 15 percent can shift overall exploration metrics by up to 11 points.
Regional Studio Practices and Data Patterns
Mid-tier teams in Central Europe often integrate marker systems during early production cycles, drawing on player heatmaps gathered from prior projects. Observers note that games developed in Warsaw and Prague studios display tighter marker groupings near narrative hubs, while titles from smaller Dutch outfits spread indicators more evenly across secondary zones. In August 2026 a joint analysis by the European Games Developer Federation and researchers at the University of Warsaw examined twelve such releases and documented a consistent statistical link between density thresholds and completion rates, with lower-density configurations supporting sustained player engagement across 80-hour play sessions.
Telemetry logs further reveal that players in these titles complete side objectives at higher rates when markers remain visible only after primary path milestones, reducing visual overload. One dataset covering 340,000 sessions found that optional marker toggles increased exploration completion by 19 percent in atmospheric regions, whereas permanent on-screen indicators sometimes prompted quicker route selection and lower overall map coverage.
Statistical Methods Applied to Completion Metrics
Analysts apply regression models to connect marker density variables with percentage outcomes, controlling for factors such as world size and narrative length. Results indicate that density serves as a stronger predictor in open-zone designs than in linear sequences, where completion gaps narrow to within 4 percent regardless of marker count. Cross-studio comparisons highlight that mid-tier European releases maintain average completion figures near 68 percent when density stays below 1.8 markers per 200 square meters, a benchmark drawn from aggregated platform data released through industry channels.
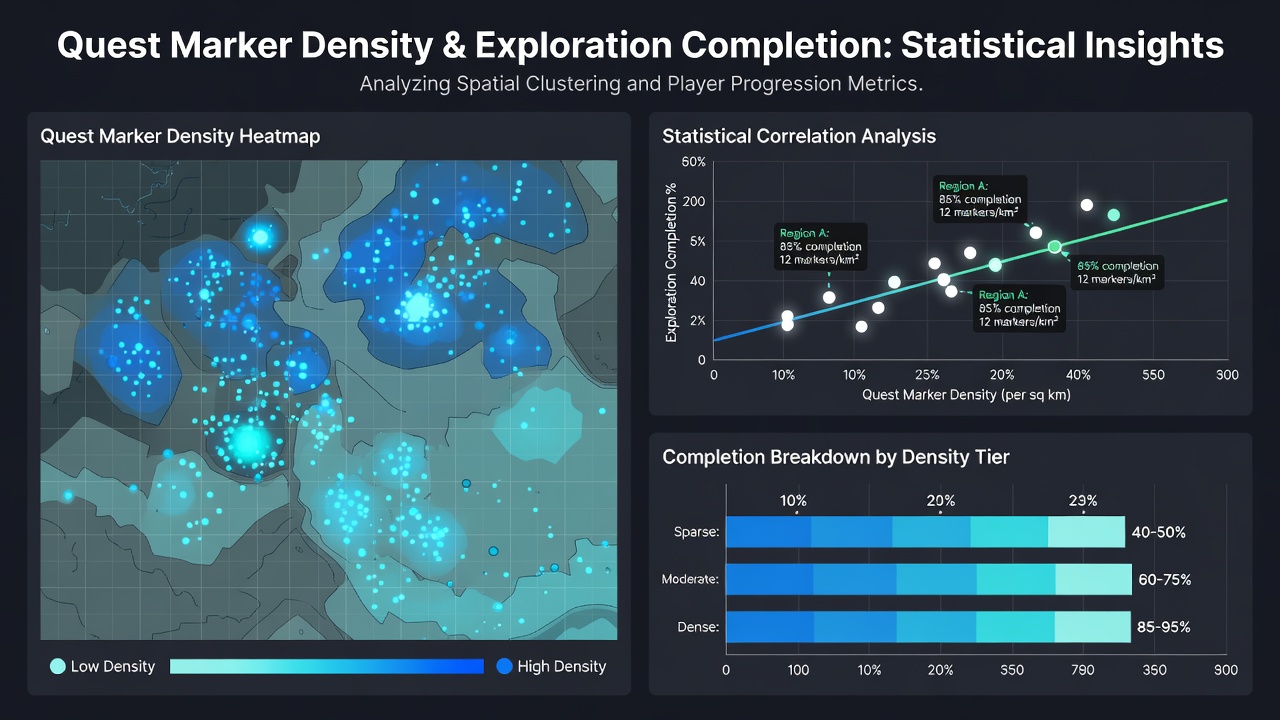
Additional variables such as marker color contrast and minimap scaling also enter these models, though density remains the dominant factor in multivariate tests. Teams that publish post-launch updates have recorded measurable lifts in completion statistics after implementing density reduction patches, with one Czech studio noting a 9 percent rise following adjustments applied six weeks after release.
Implications for Future Development Cycles
European mid-tier studios continue to refine marker placement strategies based on these statistical findings, often sharing anonymized datasets through collaborative industry platforms. The patterns suggest that balanced density supports both guided progression and organic discovery, contributing to higher aggregate completion percentages across action-adventure catalogs. Observers tracking releases scheduled for late 2026 expect further validation of these links as new telemetry streams become available from updated engine versions.
Conclusion
Quest marker density maps provide measurable indicators that connect directly to exploration completion percentages in action-adventure games from mid-tier European studios. Ongoing analyses demonstrate clear thresholds where adjustments yield predictable shifts in player behavior, offering developers concrete guidance drawn from regional datasets and platform telemetry. These connections underscore how interface design choices translate into quantifiable engagement outcomes across comparable production environments.